Conversion tracking require a Business plan
subscription or higher.
lead event happens when a user performs an action that indicates interest in your product or service. This could be anything from:
- Signing up for an account
- Adding a product to cart
- Joining a mailing list

Prerequisites
Before you get started, make sure you follow the Dub Conversions quickstart guide to get Dub Conversions set up for your links:- Enable conversion tracking for your links
- Install the @dub/analytics client-side SDK
- Install the Dub server-side SDK
Configure Clerk
Next, configure Clerk to track lead conversion events when a new user signs up. Here’s a quick video showing how to do this:
Here’s a quick summary of the steps:
1
Add environment variables
Add the following environment variables to your app:
2
Add a custom claim to your Clerk session token
Add the following JSON as a custom claim to your Clerk session token:
Clerk Session Token
3
Extend the `@dub/analytics` package with Clerk's `useUser` hook
Extend the Then, add the
@dub/analytics package to include a trackLead server action.components/dub-analytics.tsx
DubAnalytics component to your app’s root layout component:app/layout.tsx
4
Implement the `trackLead` server action
On the server side, implement the
trackLead server action. Alternatively, you can also create an API route instead:Example App
To learn more about how to track leads with Clerk, check out the following example app:Dub + Clerk Example App
See how to track new user sign-ups with Clerk and the Dub SDK.
View your conversions
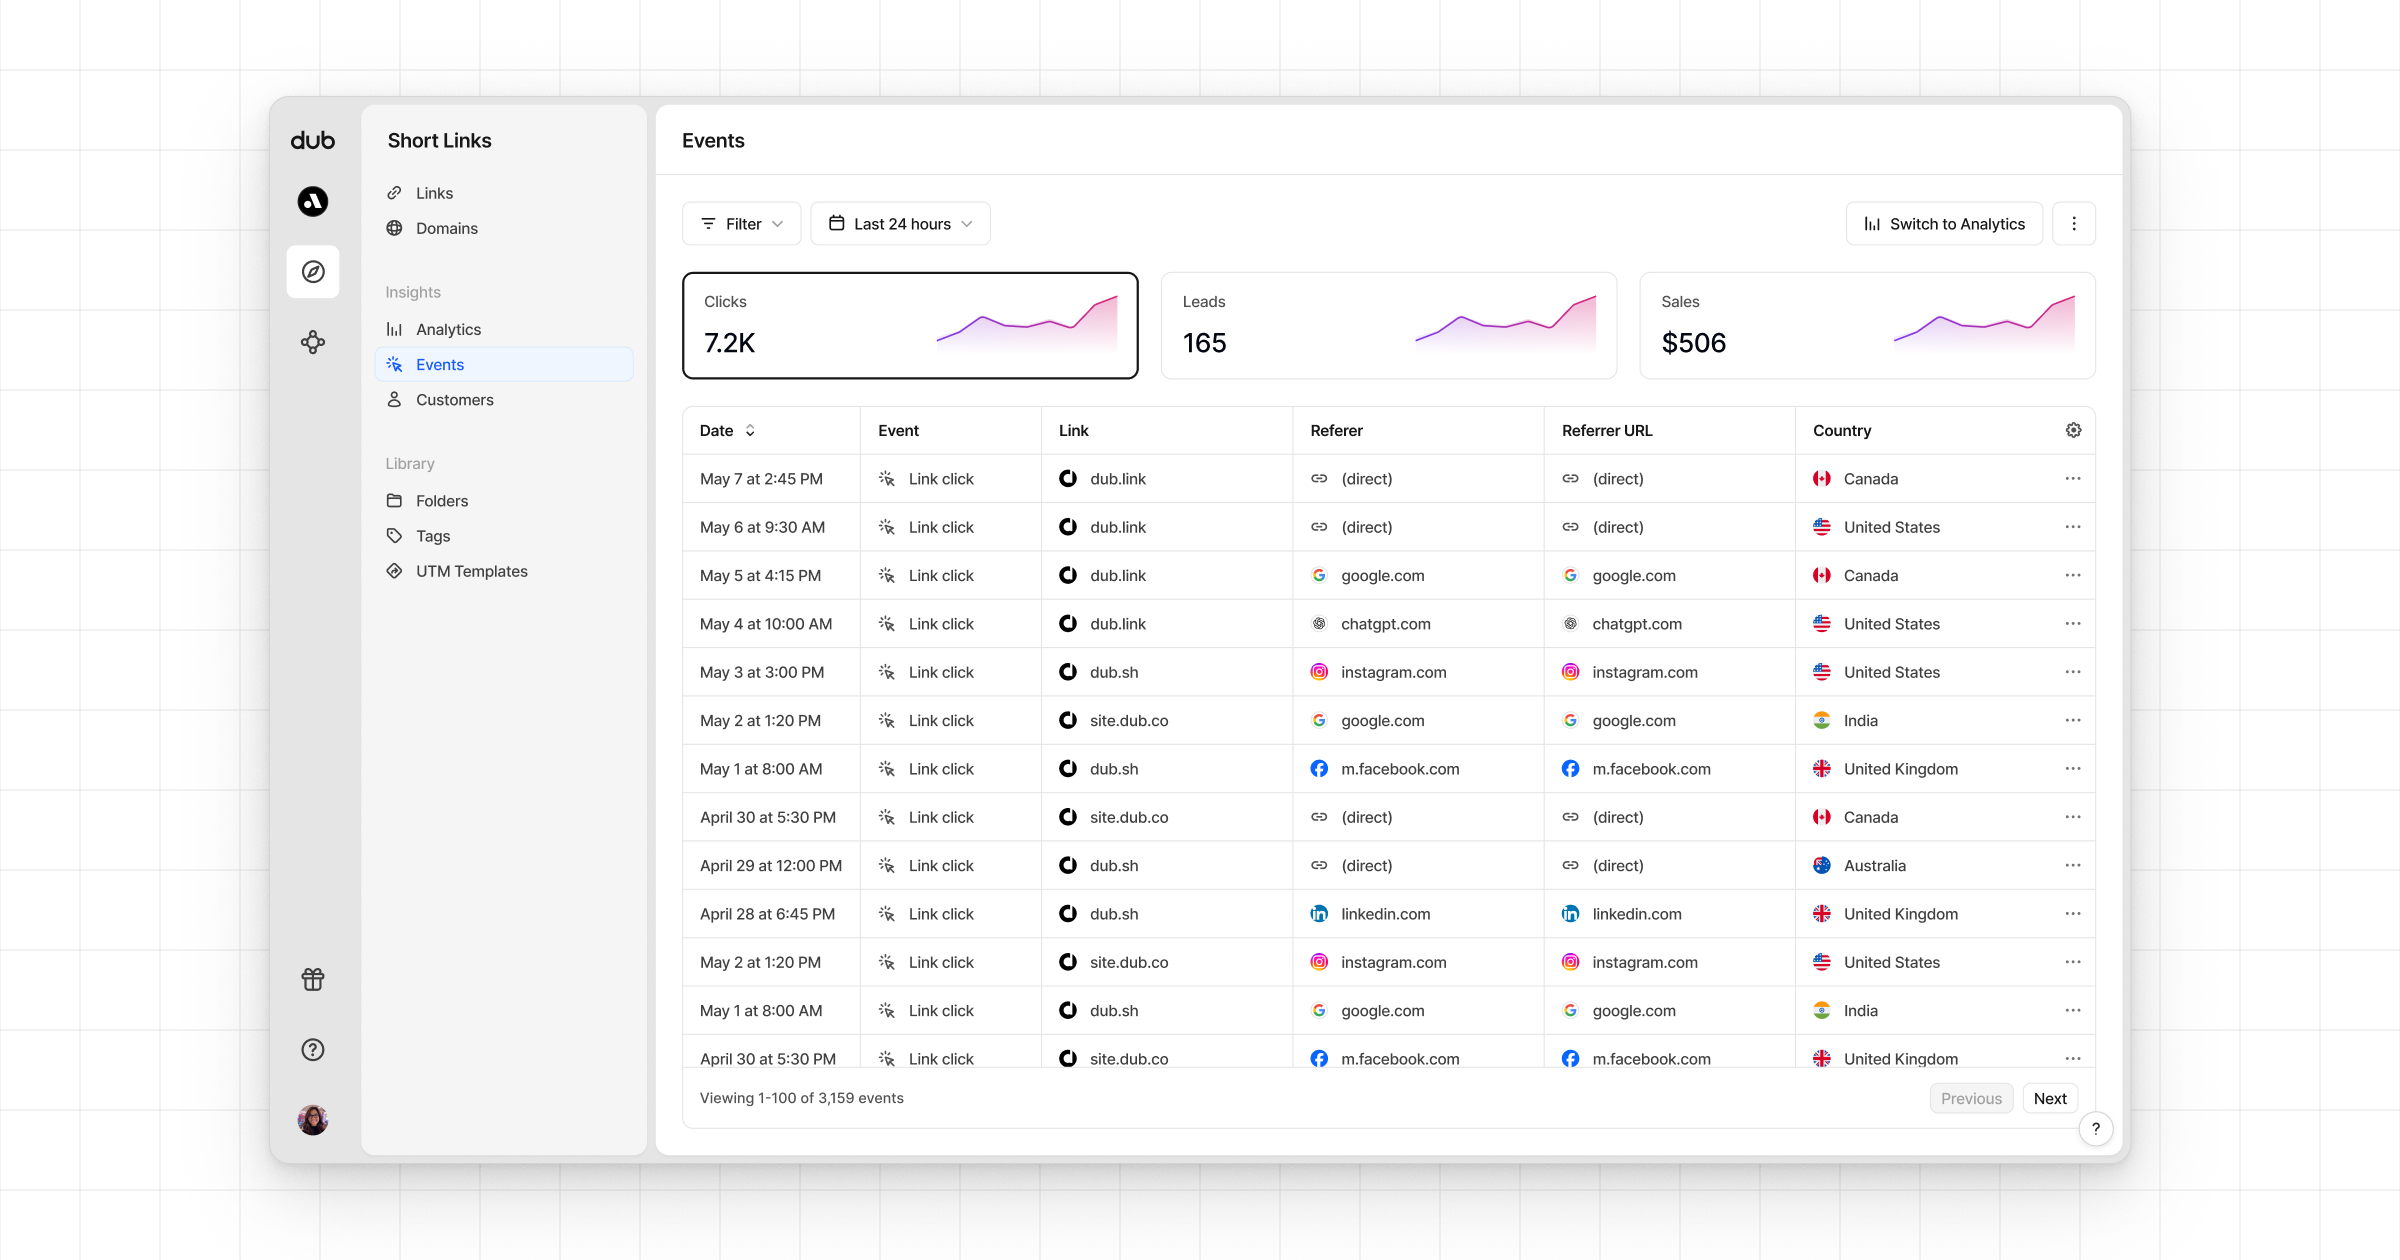
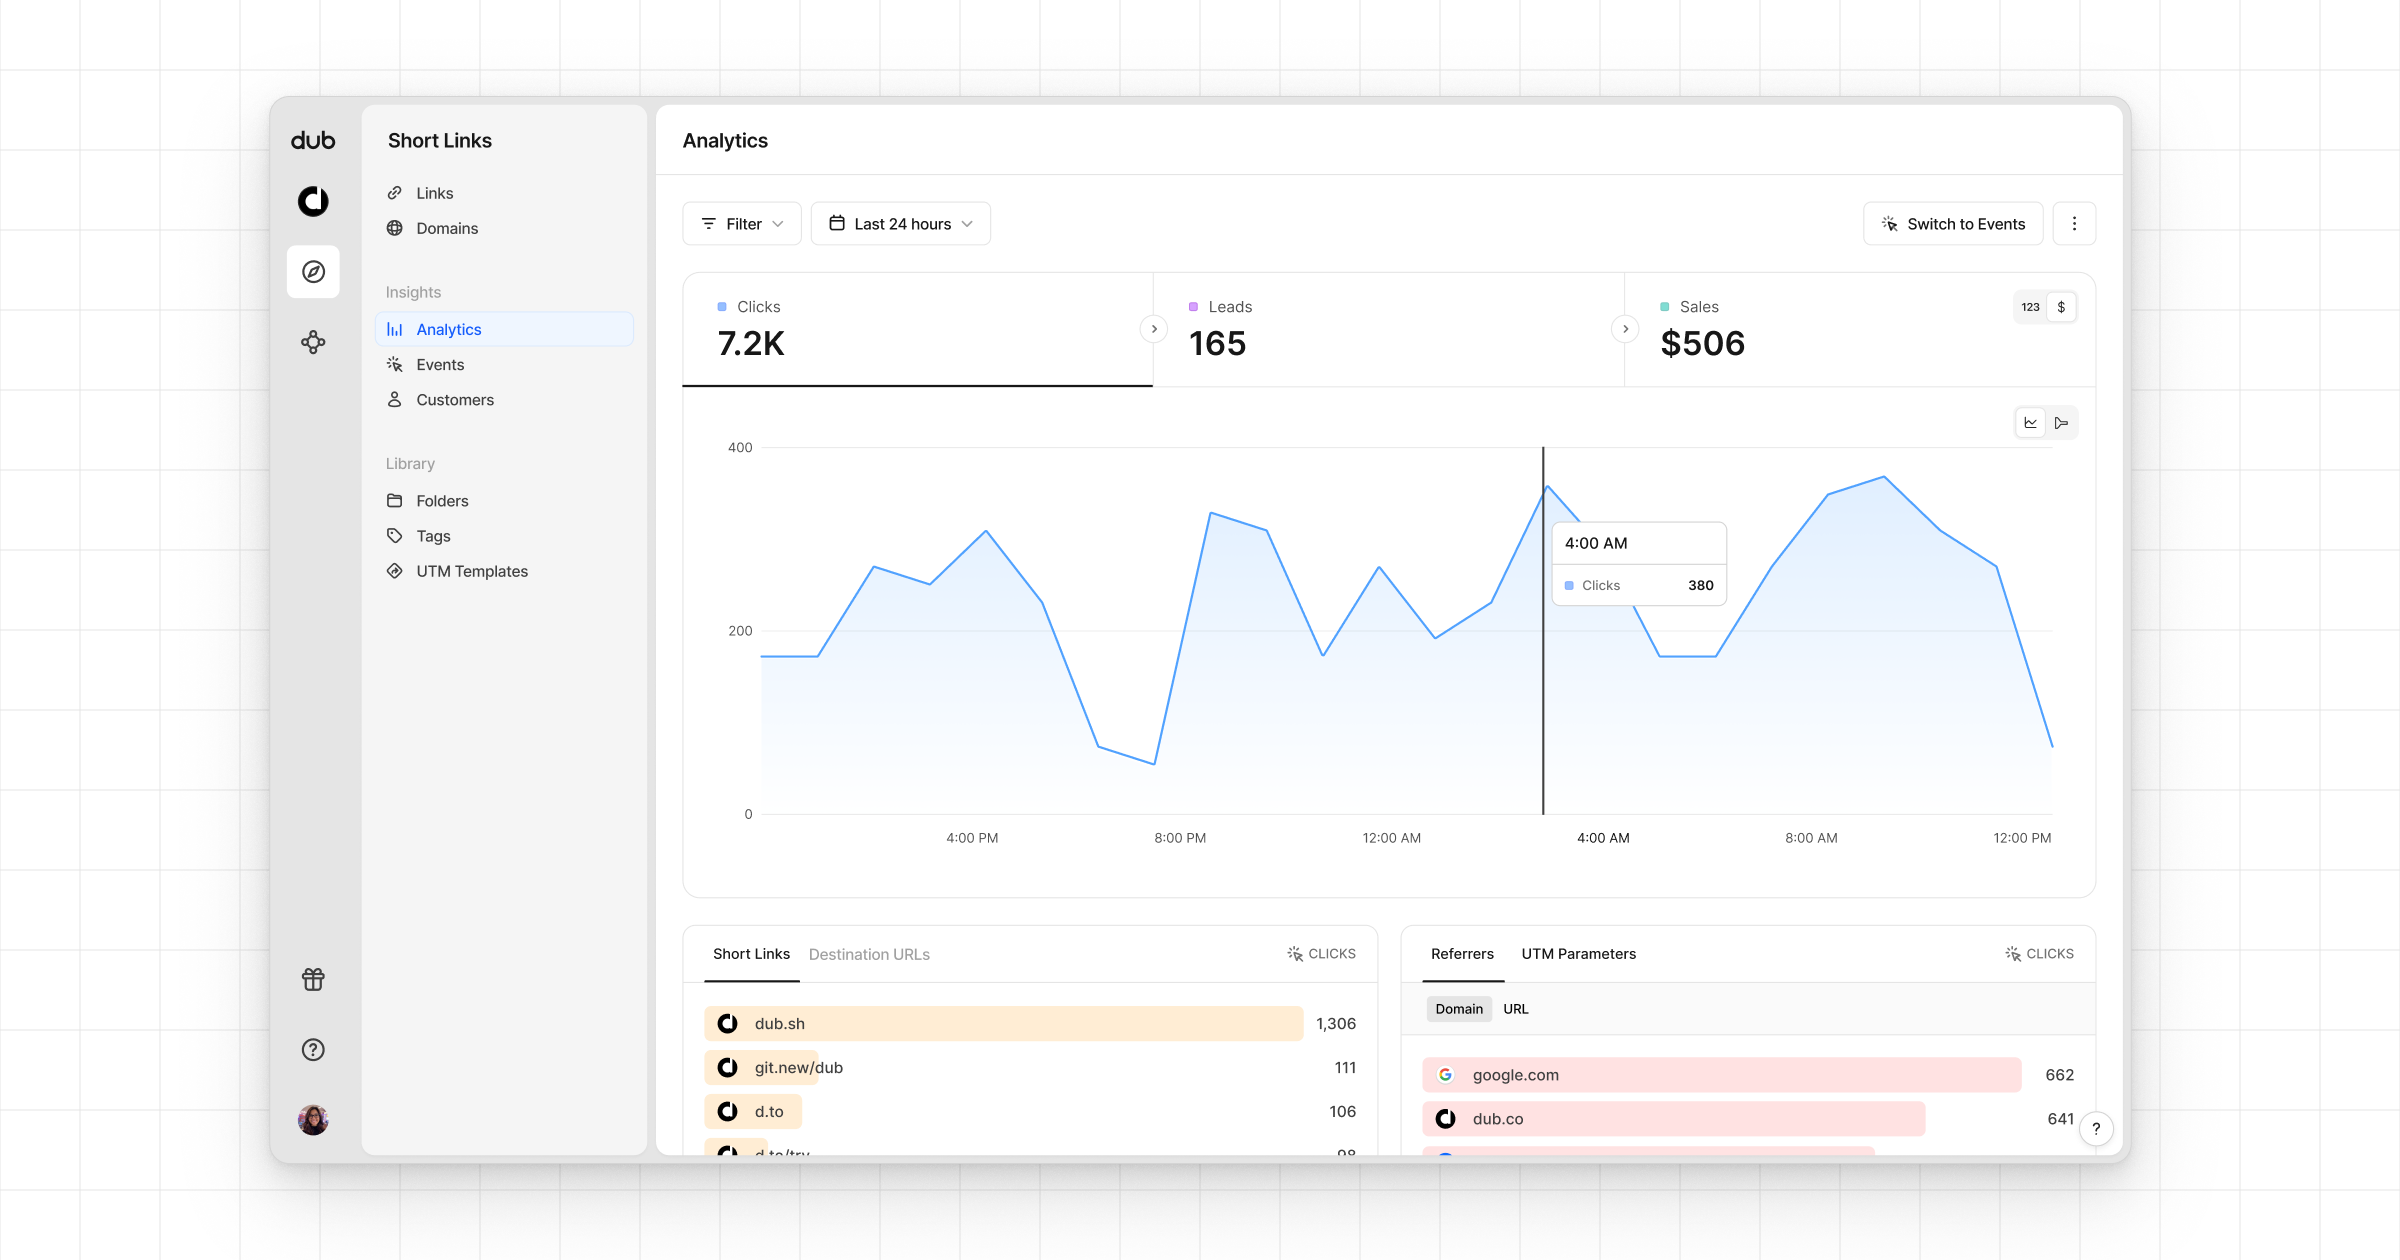
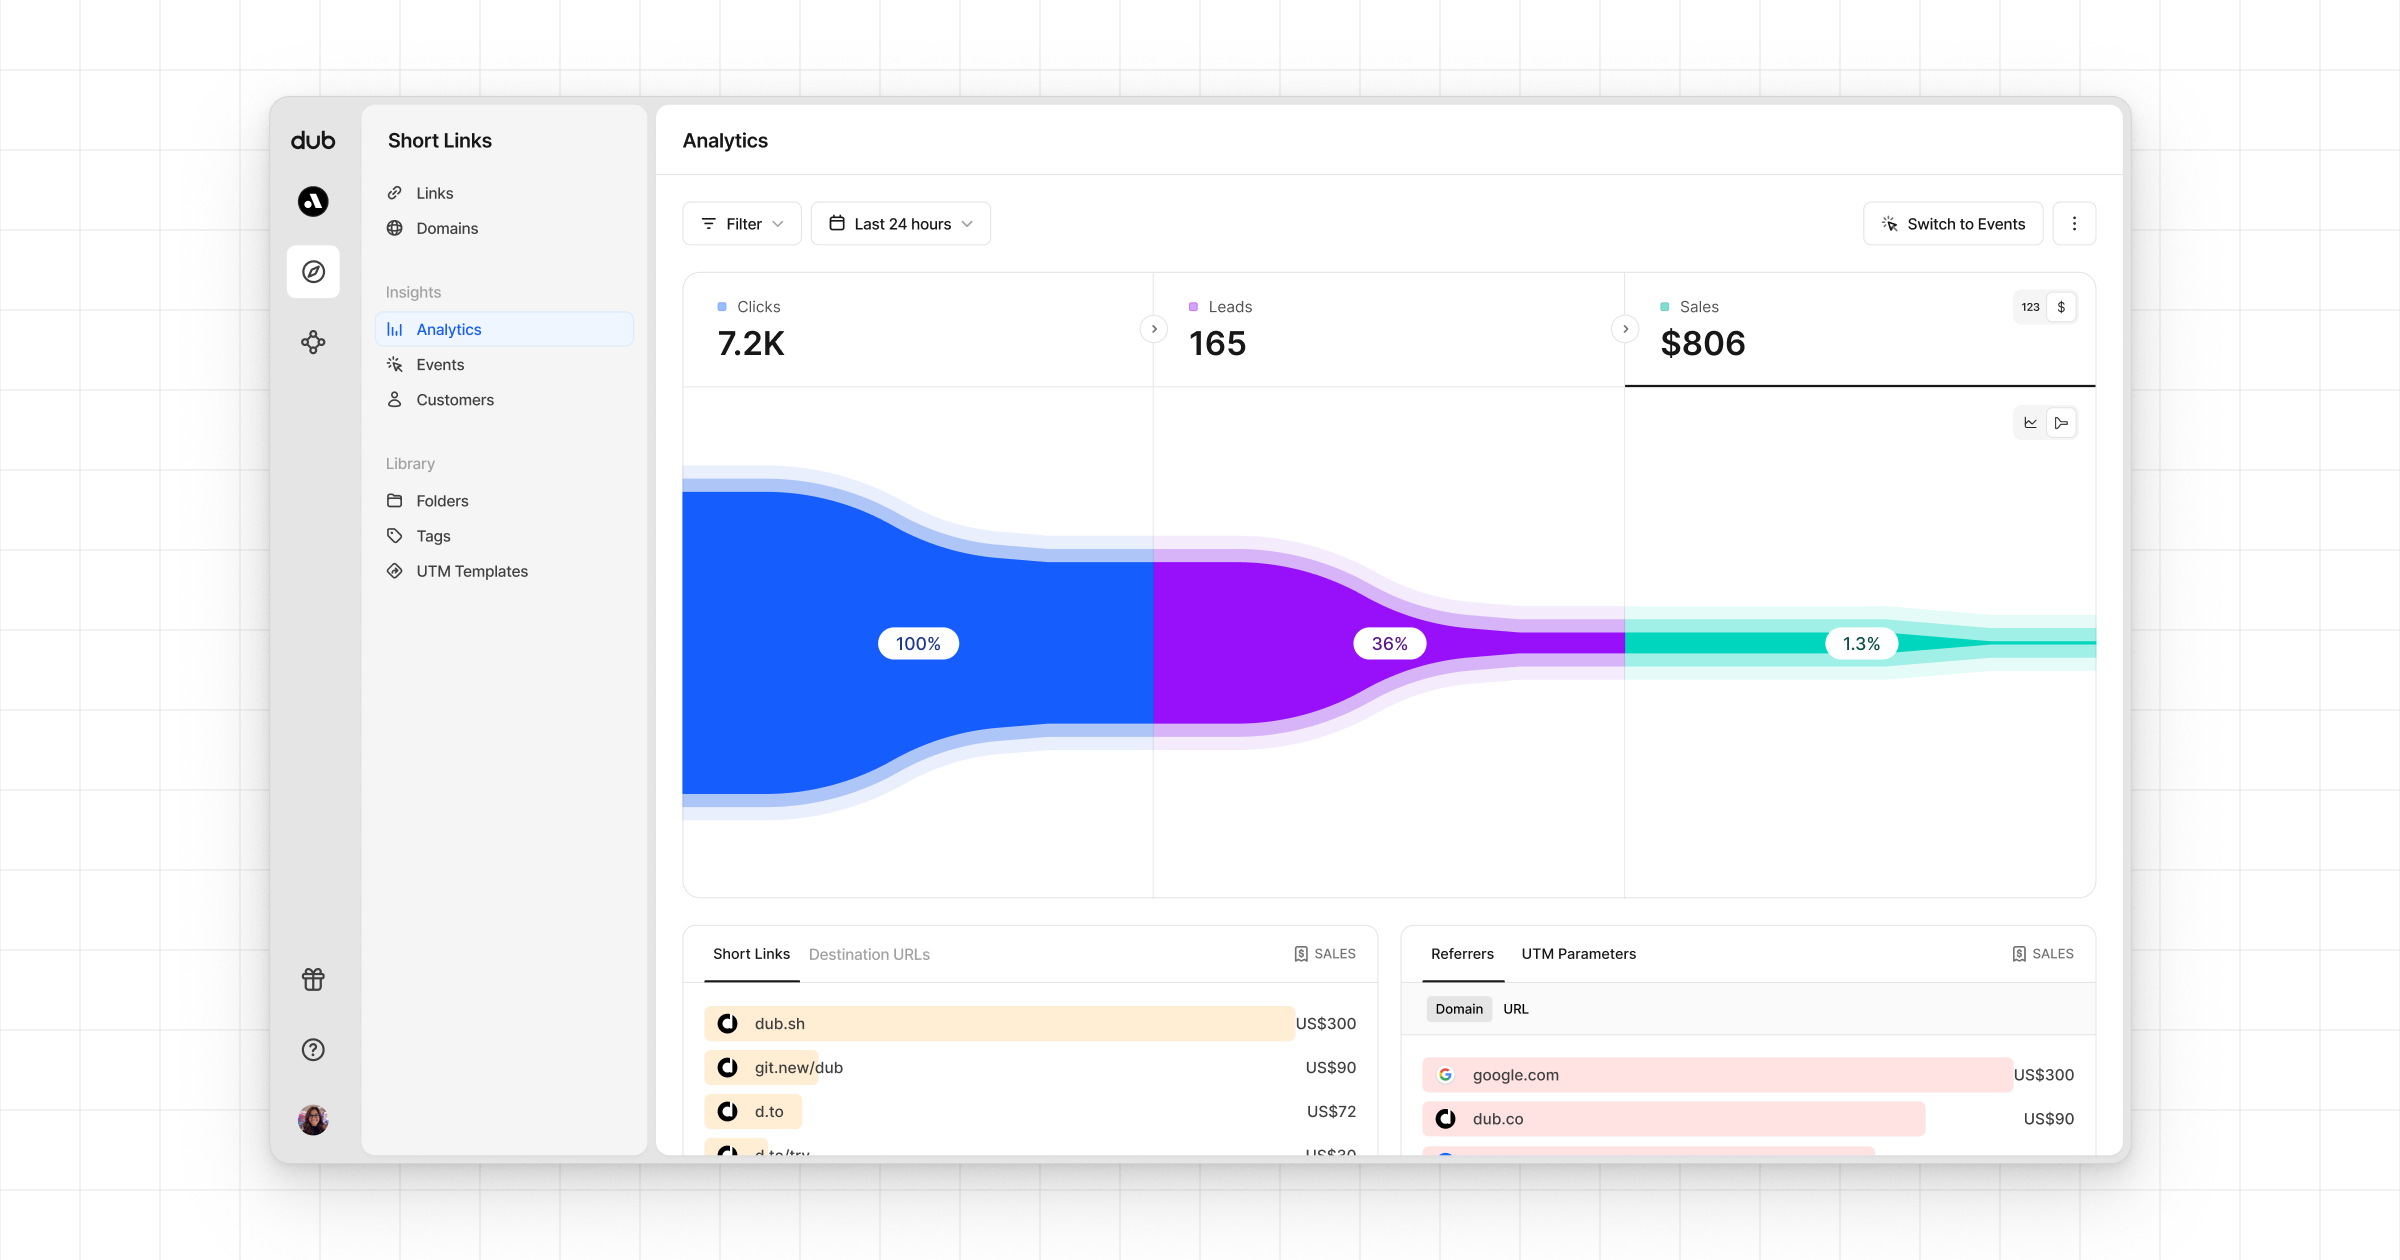
Once you’ve completed the setup, all your tracked conversions will show up in Dub Analytics. We provide 3 different views to help you understand your conversions:- Time-series: A time-series view of the number clicks, leads and sales.
- Funnel chart: A funnel chart view visualizing the conversion & dropoff rates across the different steps in the conversion funnel (clicks → leads → sales).
- Real-time events stream: A real-time events stream of every single conversion event that occurs across all your links in your workspace.